Convolution of bare arrays#
As a basic building block, the API for bare arrays exists.
Before getting into how this works, we first needs to import a few things:
import cartopy.crs as ccrs
import matplotlib.pyplot as plt
import numpy as np
from xdggs.healpix import HealpixInfo

import healpix_convolution as hc
from healpix_convolution.plotting import plot_healpix

rng = np.random.default_rng(seed=0)
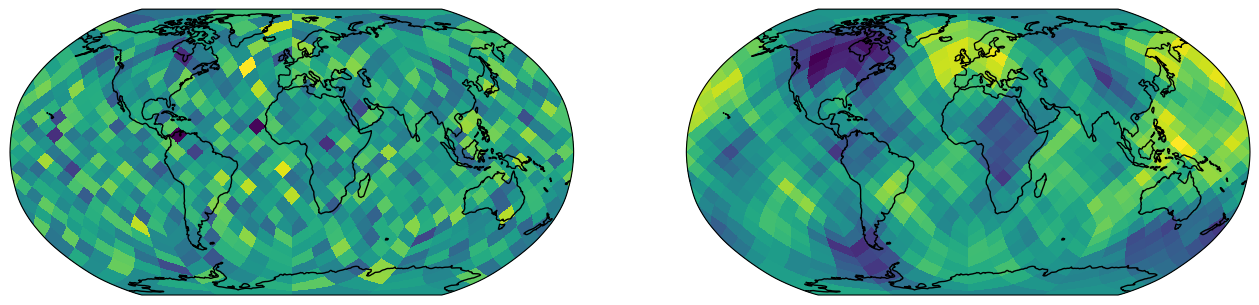
Global convolution#
We first define the grid and the data to convolve:
grid_info = HealpixInfo(level=3, indexing_scheme="nested")

cell_ids = np.arange(12 * 4**grid_info.level)
data = rng.normal(size=cell_ids.shape)
We also need a kernel:
_, kernel = hc.kernels.gaussian_kernel(
    cell_ids,
    grid_info=grid_info,
    sigma=0.5,
    kernel_size=5,
    weights_threshold=1e-8,
)
kernel
| Format | coo |
|---|---|
| Data Type | float64 |
| Shape | (768, 768) |
| nnz | 18984 |
| Density | 0.032185872395833336 |
| Read-only | True |
| Size | 444.9K |
| Storage ratio | 0.10 |
With all that, convolution is simply:
convolved = hc.convolve(data, kernel)
convolved.shape
(768,)
On a map:
fig, axes = plt.subplots(
    ncols=2, figsize=(16, 12), subplot_kw={"projection": ccrs.Robinson()}
)

plot_healpix(
    data, cell_ids, ax=axes[0], grid_info=grid_info, features=["coastlines"]
)
plot_healpix(
    convolved,
    cell_ids,
    ax=axes[1],
    grid_info=grid_info,
    features=["coastlines"],
)
<cartopy.mpl.geocollection.GeoQuadMesh at 0x7e54195213a0>
/home/docs/checkouts/readthedocs.org/user_builds/healpix-convolution/conda/stable/lib/python3.12/site-packages/cartopy/io/__init__.py:241: DownloadWarning: Downloading: https://naturalearth.s3.amazonaws.com/110m_physical/ne_110m_coastline.zip
  warnings.warn(f'Downloading: {url}', DownloadWarning)
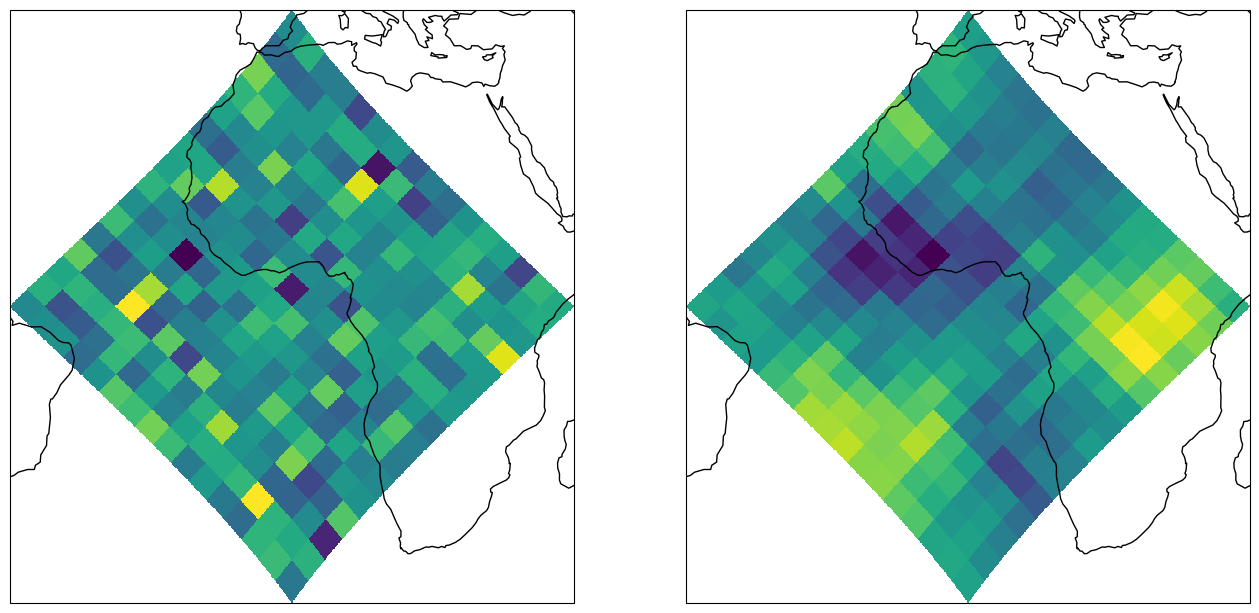
Regional convolution#
Similarly to above, we also first have to define the data:
grid_info = HealpixInfo(level=4, indexing_scheme="nested")

cell_ids = 4 * 4**grid_info.level + np.arange(4**grid_info.level)
data = rng.normal(size=cell_ids.shape)
and we can immediately define the kernel:
kernel_size = 5
_, kernel = hc.kernels.gaussian_kernel(
    cell_ids,
    grid_info=grid_info,
    sigma=0.5,
    kernel_size=kernel_size,
    weights_threshold=1e-10,
)
kernel
| Format | coo |
|---|---|
| Data Type | float64 |
| Shape | (256, 392) |
| nnz | 6382 |
| Density | 0.06359614158163265 |
| Read-only | True |
| Size | 149.6K |
| Storage ratio | 0.19 |
However, since we now have boundaries we have to pad the data before convolving:
padded_data = hc.pad(
    cell_ids,
    grid_info=grid_info,
    ring=kernel_size // 2,
    mode="constant",
    constant_value=0,
).apply(data)
padded_data.shape
(392,)
After that, convolving works as before (but on the padded data):
convolved = hc.convolve(padded_data, kernel)
Again, we can look at the result:
fig, axes = plt.subplots(
    ncols=2, figsize=(16, 12), subplot_kw={"projection": ccrs.Robinson()}
)

plot_healpix(
    data,
    cell_ids,
    ax=axes[0],
    grid_info=grid_info,
    features=["coastlines"],
    xsize=3000,
)
plot_healpix(
    convolved,
    cell_ids,
    ax=axes[1],
    grid_info=grid_info,
    features=["coastlines"],
    xsize=3000,
)
<cartopy.mpl.geocollection.GeoQuadMesh at 0x7e541a5004a0>